EarthView team bios, guidelines, and more.

Monday, April 29, 2013

Trade Atlas


From the Massachusetts Institute of Technology (MIT) in Cambridge comes a fascinating online atlas that has no maps in the traditional sense. The Observatory of Economic Complexity is a model of all the world's imports and exports. The scale of the map represents the percentage of trade in any given category. The legend includes shading by type of export -- food, transportation, medical, and so on -- or by region of the world for some of the charts.

Users of the chart can examine the trade between any two countries, or between a single country and the entire world. Warning: this is so interesting that it can be habit-forming!

The atlas does not include three very important ways that money can flow between countries, some of which can be important in certain cases. It does not include tourism, donations of aid, or remittances (which are funds sent by migrants working in another country back to their families at home).

Zipper-dee-doo-da!

The EarthView blog often includes anniversaries related to geography. Today is the centennial of an event that is essential for EarthView itself. On April 29, 1913, Gideon Sundback received a patent for the modern zipper. 


His design was an improvement on the work of others, but it was such a dramatic improvement in simplicity and reliability that Sundman is widely considered the inventor of the modern zipper. Last year his birthday -- also in April -- was recognized by a Google doodle.


As we mentioned when the EarthView zipper was replaced about a year ago, without the zipper, EarthView itself would be impossible. To keep the zipper working smoothly, the EarthView wranglers frequently apply natural beeswax to its zipper.


Wednesday, April 24, 2013

EarthView at Stoughton

Through the occasional offering of EarthView Institute, Bridgewater State University is able to offer "EarthView Driver's  Licenses" to geography teachers throughout the region who wish to implement geography programs in their own schools. Stoughton's John Gunning and Rachel Killian were among the first to complete the course, enabling them to lead an exciting two-day program at the O'Donnell Middle School this week.

See the Wicked Local article Middle School Students Celebrate Earth Day in a BIG Way for more photos and details.


Tuesday, April 16, 2013

Oceans Five

Oceans are defined by a combination of their underlying geology, patterns of circulation, and human interaction. Just 13 years ago, a fifth ocean was "created" by defining parts of three others as a new entity, based on a prevailing current that circles Antarctica.
Click image for a better view.
As described on Geography.About.com, the Southern Ocean was defined in the spring of 2000. What was the only ocean at that time that did not cede part of its area to the new creation? The Southern Ocean is defined by the 60th parallel of southern latitude. This is not the one shown in yellow above, which is the Antarctic Circle, and which is very close to the Antarctic coastline on the eastern side. Rather, it is the parallel that is shown between 55 and 65 degrees. This corresponds very closely to the edge of the floor in EarthView, where Antarctica and the Southern Ocean are the only parts of the globe that are not hand-painted.

Read the oceans article on About.com for interesting information about each of the five oceans and their geographic importance. For the story about how the identity of the Atlantic Ocean came to be known so late in human history, see Biography of an Ocean (note that this article is on the archive version of our blog at its previous address, where many geography articles can be found).

Tuesday, April 2, 2013

Out of this World -- Sort Of

The geographers at Bridgewater State University are fortunate to have good relationships with geographers around the world. One of these is Dr. Francisco Henrique de Oliveira of the University of the State of Santa Catarina in Florianopolis, Brazil. As a specialist in surveying and mapping, he shares many interesting stories and images related to geotechnology.

He recently shared this graphic, which compares seven satellite orbits, including those of the International Space Station (ISS) and the the Global Positioning System (GPS). The highest orbit shown is the geostationary category, which includes a variety of satellites -- such as those used for television -- that need to stay in a constant position over the earth. (Learn more about GPS from our Where We Are post.)


We are working on exercises to compare these orbits at EarthView scale. For example each of the 24 satellites in the GPS system would orbit about 30 feet away from the surface of EarthView.

Please notice a few things about the diagram.

First, although it might seem to imply that all orbits run over the North and South Poles; this is not the case but simply makes the diagram readable.
Second, notice that the distances are expressed both as height above sea level and radius from the earth's center; the difference, of course, is the radius of the earth, about 4,000 miles.
Third, notice that the speed varies with height, with lower-orbiting satellites moving much faster than those at greater height.
Finally, notice that the time required to complete a full orbit increases with height; this is relationship between increased circumference and decreased speed as height increases.

Friday, March 22, 2013

World Water Day -- March 22

During our visit to Tenney Grammar School in Methuen, the EarthView team celebrated World Water Day, which has been recognized by the United Nations since 1993. Secretary-General Ban Ki-moon explains the importance of the day.


Tenney School's participation in World Water Day has been recognized by the United Nations!

See the UN Water Day Interactive Map

Check out how we celebrated World Water Day inside EarthView!


World Water Day reminds us of the early weeks of 2010, when the EarthView team followed the progress of Katie Spotz and her record-breaking effort to generate awareness of the need for clean water. She raised $150,000 dollars for clean water as she entered the record books. See Row for Water to learn all about her journey.

Thursday, March 21, 2013

Tenney Grammar School - March 22

42° 43' 52.608" N
    71° 10' 38.7732" W
Learn more about Lat/Long (including how to look them up by address)

The EarthView team is excited to be at Tenney Grammar School in Methuen! We have heard you are studying all about the world in Geography class, specifically your focus on the continents of Asia, Africa and Europe. What geographical information have you learned about these continents?


Something you may not have learned about Europe is the recent discovery of fossils, dating back to the time of dinosaurs! A 9 year old girl has recently discovered a new species of pterosaur after taking a walk on the beach. Daisy Morris of England was walking along the Isle of Wight, and saw blackened bones sticking out of the sand. Daisy and her parents immediately brought the fossil to Martin Simpson who is a paleontologist at the University of Southampton. The fossils were examined and paleontologists came to the conclusion that it was a new species of Pterosaur. A pterosaur is a flying reptile that lived among the dinosaurs. The new species of pterosaur was named Vectidraco daisymorrisae, after its 9 year old finder. The Vectidraco daisymorrisae was said to be an expert flyer, living about 145 to 65 million years ago. The Pterosaur was only a foot long, similar to a crow. A new children’s story titled “Daisy and the Dragon” was written by Martin Simpson, shortly after the discovery.

                                                  An illustration of a flying pterosaur.


Today is March 22nd which marks the 16th anniversary since the sighting of Comet Hale-Bopp!


Comet Hale- Bopp was a comet discovered by Alan Hale and Thomas Bopp on July 23, 1995. The center of the comet is estimated to be about 24 miles wide! Hale- Bopp comet set the record for being visible on Earth for 18 months. Although it was visible for 18 months, 16 years ago today on March 22, 1997, Comet Hale- Bopp had its closest approach to Earth! This comet is one of the brightest comets to reach the inner solar system in history. The comet is currently just beyond the orbit of Uranus, but it can still be seen by a telescope. This viewing of Hale- Bopp comet is expected to last until 2020, and then will not return again until the year 4534!


Another fact about today is that it is World Water Day!

How much water do YOU usually use in one day? Did you take a shower? Brush your teeth? Flush the toilet? Wash your hands? Eat food? Drink a water bottle? 
Today is World Water Day! World Water Day was declared by the United Nations General Assembly on March 22, 1993. In order to support World Water Day, people are encouraged to not use their tap water throughout the entire day. The purpose of Water Day is to spread public awareness and encourage water conservation is everyday life. There are billions of people around the world without access to safe drinking water. Many families have to walk far distances just to get a glass of water to drink! Many people are celebrating with different events all over the world, but this year’s official Water Convention will be held today in South Holland hosted by the Government of The Netherlands. The theme for this year’s celebration is ‘Water Cooperation’. For more information you can visit

http://www.unwater.org/water-cooperation-2013/home/en/

How will YOU celebrate World Water Day?       


Monday, March 18, 2013

Cape Verde: Global Crossroads

Southeastern Massachusetts is home not only to EarthView, but also to many thousands of people from the Atlantic island nation of Cape Verde. By some estimates, more Cape Verdeans live in Massachusetts than in Cape Verde itself, because the Cape Verdeans here include people who arrived last week, people whose ancestors arrived on whaling ships more than a century ago, and generations of arrivals in between. Many of those migrants arrived on a ship that can be found in New Bedford Harbor to this day, the Schooner Ernestina, a former whaling ship that became the last vessel to bring migrants to the United States under sail.
Map source: Sandgrains, a film about resource depletion in Cape Verde
This map is more accurate than the current
Google map of the islands, which includes a major error.
The connections between Cape Verde and our region are very strong, but Cape Verde's geographic situation has helped to make it a very cosmopolitan country, with connections in many parts of the world.

One interesting connection that we often mention to EarthView participants is also relevant to the life of Pope Francis, who was elected last week to lead the Roman Catholic church. He was born as Jorge Mario Borgoglio in Buenos Aires, Argentina in 1936. His father had been born in Italy, as were earlier generations on his mother's side.

How does this relate to Cape Verde? As with the new pope's family, many workers had migrated from Italy to Argentina in the early twentieth century to work in railroads, steel, and other industries. All of that migration, of course, was by ship, but by the 1930s Italy's dictator Mussolini was interested in an air connection and needed a convenient refueling stop. Cape Verde's first international airport was built by Italy on the island of Sal (meaning Salt) in 1939.

The location at Sal was chosen for several geographic reasons. First, Cape Verde is situated near the direct route from Rome to Buenos Aires (click to enlarge the map below, and you will see that Cape Verde is just to the northeast of the path). Second, the site characteristics of the island of Sal include flat topography in comparison to the other islands. Third, Cape Verde was a territory of Portugal, at that time headed by Mussolini's fellow dictator, Salazar.
Click to enlarge. Get more flight paths from
GPS Visualizer
The other line on this map shows a more personal connection for the EarthView team. Dr. Domingo is from Port Elizabeth, South Africa, and when visiting home he flies from Boston to Johannesburg. That flight can be done in several ways, one of which is to stop for refueling in Cape Verde, as Sal is very close to the direct route -- even closer than it is to the Rome-Buenos Aires route. In addition to Dr. Domingo's layovers, the EarthView Experience includes Dr. Hayes-Bohanan's BSU study tour to Cape Verde in 2006, with another planned in 2014.

The Space Shuttle never landed in Cape Verde, but the long runway at
Sal was among its designated emergency landing strips.
One result of Cape Verde's many connections to other places is that Cape Verdeans are among the most polyglot people on the planet. We often meet children from Cape Verde who speak three, four, or even five languages. All Cape Verdeans speak Cape Verdean Creole and most speak Portuguese as well. Those from Sal may speak Italian, and connections to the Canary Islands and Senegal make Spanish and French common as well. And of course the Cape Verdeans we meet have learned English, either in school back home or when they arrive here.

Both of the routes shown on the Atlantic map above are Great Circle routes, which always represent the most direct route between two points. On a globe, such routes can be found by holding a string on both points, pulling it snug. Inside EarthView, we can represent them with our laser pointers. On most flat maps, these direct paths are represented as curves, sometimes with surprising results. Airline routes sometimes differ from great-circle paths because of prevailing winds or storms, but planning usually begins by calculating the shortest distance.

Friday, March 15, 2013

Sharon Middle School -- March 15

42° 06' 24" N
71° 09' 58" W 
Learn more about Lat/Long (including how to look them up by address)
Also, compare today's coordinates to those of other recent EarthView outings, near and far!
 

NOTE: It was a very snowy year. This visit was postponed until May 24.

This is EarthView's second visit to Sharon Middle School. The blog post for our April 2012 visit describes the town of Sharon in terms of both site and situation -- geographic characteristics of the place itself and of the place in relation to other places. Just as that visit took place on the anniversary of historic events with geographic significance, so also does this Ides of March visit.

March 15 in Geographic History
1991 Amazon territories Roraima and Amapa become the last states of Brazil
1988 NASA reports damage to the ozone layer, caused by chloroflourocarbons
1971 First Internet chat rooms
1966 Watts riots in Los Angeles
1964 President Lyndon Johnson calls for War on Poverty
1961 South Africa withdrew from the British Commonwealth
1960 Key Largo Coral Reef Preserve established as the first underwater park, now part of the Florida Keys National Marine Sanctuary
1957 The United Kingdom becomes the third country to explode a nuclear bomb
1952 The greatest 24-hour rainfall began on the French Island of La Reunion, with 187 cm recorded. Where is this located, and how much rain would this be in inches? How tall are you in centimeters?
1869 Cincinnati Red Stockings become the first professional baseball team


Friday, February 1, 2013

Stanley Elementary, Waltham - February 1


N 42°22'04"
W 71°15'08"
Learn more about Lat/Long (including how to look them up by address)

The EarthView team is very exciting to be back at Stanley Elementary School! Our last visit was almost exactly one year go, on February 3rd. Waltham is commonly known as Watch City, because it was a major part of the watch industry. Waltham Watch Company opened it's company in 1854 as the first company to make watches on an assembly line. The company produced over 35 million watches, clocks and instruments before closing in 1957. 


The city of Waltham stretches along the Charles River, which contains several dams. These dams were once used to power textile mills in the early years of the industrial activity. 


What Happened Today?:

2004: Super Bowl XXXVIII, Reliant Stadium, Houston, New England Patriots beat Carolina Panthers 32-29

1914: New York Giants and Chicago White Sox play an exhibition baseball game in Egypt


1884: First volume of the Oxford English Dictionary, A-Ant, published

What's in the News?

The Colosseum is a structure built in Rome, Italy during the first century. It is constructed out of concrete and stone and was once used for various entertainment. The Colosseum is very large and held up to 50,000 people. Throughout the years, the structure has been covered with various works of graffiti art. Experts have recently discovered layers of inscriptions on one section of a wall that was left by visitors thousands of years ago. These inscriptions were found in the upper tier section, where woman, children and slaves once sat in the cheap seats to watch the entertainment. The exact meaning of the inscriptions remain a mystery, but experts continue to research and formulate theories. Symbols such as "Victory" and "Vengeance"have been reportedly found. Many visitors wanted to announce their presence, so names and dates were recorded all around. On this piece of wall, in 1892, J. Milber wanted the world to know that he had traveled there from the city of Strasbourg. 


The bald eagle is the national bird of the United States. The eagle can be found on numerous United States merchandise, including the official seal and 25 cent quarter. However a new type of bald eagle has been spotted feeding on the Nooksack River near Bellingham, Washington. This bald eagle is different based on his color. It appears to be an albino- like bald eagle. The color of this bald eagle is most likely due to a condition known as "leucism". Leucism is a mutation that prevents melanin, or pigment, from being produced in parts of an animals body. In this particular bald eagle, the mutation has caused the pigment to be absent from some feathers. Bald eagles were once a federal endangered species, however through conservation efforts they have reproduced to a stable population once again. The bald eagle was at a low 16,000 birds in 1999 but has rebounded to at least 26,000 in 2011. Although the bald eagle is no longer considered an endangered species, this particular albino- like bald eagle is a one of a kind!


Thursday, January 31, 2013

2012-2013 EarthView Schedule

UPDATED January 30, 2013

EarthView has served close to 40,000 students -- all in small groups. This means that it moves around a lot! Most programs are limited to students in the host schools, as we keep a pretty busy schedule on program days. We provide this schedule, however, to help volunteers, reporters, and fellow educators to know when EarthView might be in their communities. If you would like to see EarthView during a school visit, please contact the school itself or the EarthView team.

All towns are Massachusetts and all dates are Fridays, unless noted otherwise. "Pending" means that a date is being negotiated but has not yet been finalized.

FALL 2012
September 14: Ahern Middle School, Foxborough
September 21: Brookfield Elementary, Brookfield
September 28: Collins Middle, Salem
October 5: Burkland/Goode, Middleboro
October 19: Dearborn Gymnasium, University of Maine, Farmington
(Public event, 10 am to 3 pm, in conjunction with NESTVAL conference)
October 25-26 (Thur-Fri): North Andover Middle School, includes Thursday evening program
November 2: Burkland/Goode, Middleboro
November 9: Mashpee Middle, Mashpee
November 16: South Middle, Braintree
November 30: East Middle, Braintree
December 7: North Reading Middle, North Reading
December 11 (Tues): Elms College, Chicopee
December 14: Pending

SPRING 2013
February 1: Stanley School, Waltham
February 8: Heath School, Brookline
February 15: Hingham (Pending)
March 1: Washington D.C (pending) 
March 8: Sharon Middle School, Sharon
March 14 (Thurs): Parker Middle School, Taunton
March 15: Sharon Middle School, Sharon
March 22: Hingham (Pending)
April 8-10 (Mon-Wed): Northeast Regional Conference on the Social Studies (NERC)
April 11 (Thurs): Tantasqua Junior High, Fiskdale
April 12: Littleton Middle, Littleton
April 26: Howe Manning School, Middleton
May 2 (Thurs): Pioneer Valley School, Northfield 
May 3: Raynham Middle School, Raynham
May 6 (Mon): Nurses Hall, State House 9:00am-2:00pm
May 9-10 (Thur-Fri): Horace Man Middle School, Franklin
May 17: Furnace Brook Middle, Marshfield
May 23 (Thur): STEM Outreach Event, BSU Moakley Center (2:30-5:30 pm)
May 24: Sharon Middle School
May 31: Mashpee Middle School
June 7: Tantasqua Regional Jr. High School, Fiskdale
June 14: West Street School, Southbridge

Friday, December 21, 2012

Apocalypse Not

"Tonight I'm gonna party like it's 

baktun 12 katun 19 tun 19 uinal 17 kin 19 Haab: 2 Kankin Tzolkin: 3 Cauac"

This winter's solstice coincides with the beginning of 2 baktun


I remember once pulling into a friend's driveway to take a photo when the odometer had turned over on our car. The car was no different on the way home than it had been earlier in the drive, but we stopped to mark the occasion. Similarly, we tend to celebrate our birthdays and anniversaries more if they are "major" -- 10 is a bigger deal than 9 or 12, and 100 is a really big deal. 

The mislabeled "Mayan Apocalypse" was simply a notable turnover of the "odometer" in an unfamiliar calendar system. It is a coincidence that the digits of today's date form an interesting pattern using a Gregorian calendar (what we use in the United States), just as they require an extra digit in the Mayan calendar. 

The opening line above is an allusion to the song "Party Like It's 1999," which the musician Prince released in 1982. At that time, New Year's Eve of 1999 seemed like a significant "odometer moment," and also seemed to be very far in the future!


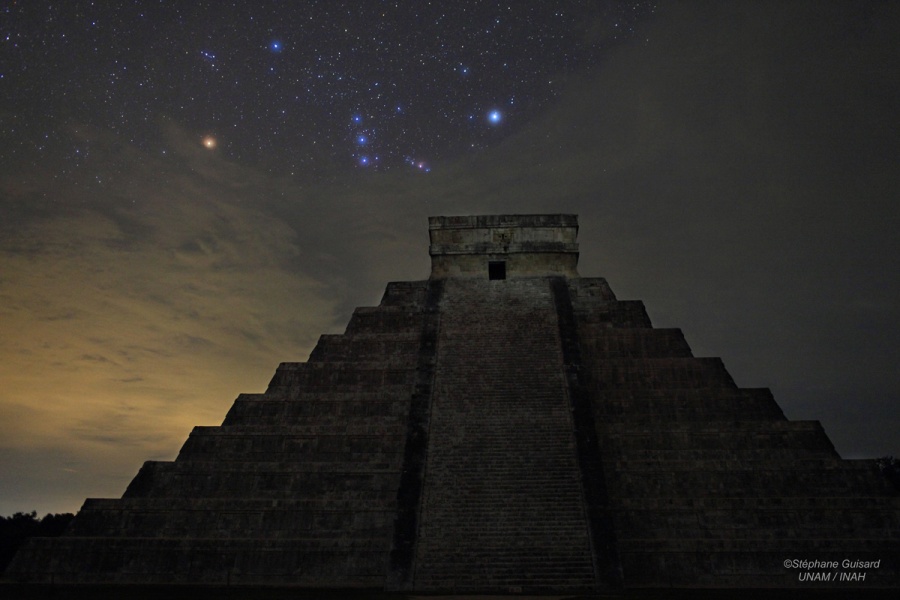
The NASA Astronomy Picture of the Day celebrates today's solstice and the flurry of attention to Mayan math and astronomy. Thanks to EarthView's administrative team member and former NASA scientist Dr. Diana Jennings for sharing this image. 

Astronomy, by the way, is related in many ways to physical geography. People of all ages are welcome to learn about astronomy at the new Bridgewater State University Observatory, which offers many public viewing nights and other programs. Both the Observatory and EarthView will soon be part of the university's Center for the Advancement of Science Education, which brings together all of the university's exciting outreach programs in science.


The Doonesbury comic for December 21 is timely and a bit cute. It gives the mistaken impression that Mayans are no longer present. Although not organized into a hierarchical society as they were when the Spanish arrived, Mayans are still found throughout the Yucatan and neighboring areas of Mexico and Central America.

In fact, Pam and James Hayes-Bohanan will be teaching about historic Mayans while working with contemporary Mayans in a college-level course next year, to be taught in Belize. It is called Maya Gold: The Geography and History of Chocolate in Belize!

Monday, December 10, 2012

Population Primer

Our friends at geography.about.com recently posted reposted an article about the growth of the world's population over the past twenty centuries and to the end of the current one. (The article also has a lot of links to other useful articles about population.) I quickly copied the numbers into Excel to make the following simple graph.
Viewed from Year 1 (A.D. or C.E. -- Current Era) until 2083, population takes the form of the letter J, or perhaps a hockey stick. That is, it grew very gradually for 1800 years (and for about 8,000 years before that), and really grew significantly only in the past century or two. The population has more than doubled, in fact, since the members of the EarthView team were born. This is not true of the Wranglers who are still in college, though the planet now has almost 2 billion people on it than when they were born!

A J-curve represents exponential growth, which shows no sign of stopping. A more careful look at these numbers, however, reveals that the growth is actually not shaped like a J. By graphing the data only since 1804, a subtle but important shift in the pattern can be more easily seen.
These are the same numbers, except that the earlier, long period of very slow growth has been removed. Rather than a J, the growth resembles an S, which is why this pattern is called sigmoidal, after sigma, which is the Greek letter equivalent of S.

This kind of growth occurs with many living things, including humans. Rapid growth often occurs when resources are abundant, and then slows as resources become scarcer. What looks like unstoppable growth slows down when limitations are reached.

In the case of humans, agriculture allows for significant growth, but industrialization allows for growth that is much more rapid, at least initially. Many regions have experienced what geographers call a demographic transition, as the rapid growth eventually slows. As explained on the BBC "Bitesize" article on population change and structure, these changes do not result from rising birth rates, but rather from falling death rates.

Most of the world's industrial countries -- such as the United Kingdom, the United States, Italy, and Japan --
have been through some version of the demographic transition and now have relatively slow growth, or even negative growth. Many developing countries -- such as Mexico and Brazil -- are near the end of such a transition. Most importantly, even in countries where population growth rates remain high -- such as Kenya and Jordan -- the transition is beginning, and growth is beginning to slow. (See the Census Bureau International Database detailed estimates of population change in these and all other countries.)

CLICK to ENLARGE
Mexico's current population pyramid shows that the country's population has
 been growing in recent generations, but that growth in the future
will be slower. This kind of graph is more properly called an
age-structure diagram because not all countries resemble pyramids.
The Census IDB generates diagrams for individual countries by year.
National Geographic provides a
 lesson on making andinterpreting the diagrams.
The result is that although human population is expected to grow by an additional 3 billion people before this century is ended, it is not expected to grow much beyond that.

For geographers and other scientists who are concerned about the demands a growing population places on natural resources, it is encouraging to see that the growth of population is slowing down. Biologist E.O. Wilson has described this curve as a "bottleneck" because it shows a period of rapid growth that is lasting for only a couple of centuries. For a long time before and after this period, human population growth was and will be very slow. Most of the plants, animals, and resources that survive this rapid change are likely to survive long-term, but survival during this period requires a lot of care and protection.


Saturday, December 8, 2012

Volcano Roundup

When speaking yesterday with North Reading students about my 1989 visit to the world's smallest volcano, one student asked about the world's largest volcano. By a variety of measures, Mauna Loa holds this distinction. It rises 13,677 feet above sea level, which is surpassed by many volcanoes, but nearly 30,000 feet from the sea floor, and 56,000 feet (eleven miles!) from its base within the ocean crust. It is so massive that the crust dips more deeply into the mantle below it. Mauna Loa is also a fairly active volcano, with 33 documented eruptions since 1843.


View Larger Map

Although located in the middle of the Pacific Ring of Fire, Mauna Loa is not part of the Ring of Fire. Rather, it is a hot spot volcano, similar to those that have formed Iceland and Cape Verde. Such volcanoes form in the middle of ocean plates, as they pass over hot spots deep in the earth. If the spot alternately hot and cool, the result can be a line or arc of separate volcanoes, with the most recent activity at one end of a long line of older volcanoes.


View Larger Map

More than three quarters of the world's 15,000 active volcanoes are found along the edges of the Pacific Ocean, where convergence between oceanic and continental plates results in both earthquakes and volcanic eruptions. (Fourteen of these are in Nicaragua, including the recently -- and beautifully -- erupting San Cristóbal.)

By some measures, the Yellowstone volcano is much larger, and is also considered active. A catastrophic eruption is theoretically possible, but the risks are considered remote by park officials.

When measured in terms of elevation above sea level, Mauna Loa is not even close to the top-ten list, all of which are Pacific-Rim volcanoes in the Andes of South America. The tallest volcano in the solar system, by the way, is a basaltic shield volcano on Mars. Olympus Mons towers more than 85,000 feet above the surface, with a base about the size of New York -- the state, not the city!

During our visit to North Reading, we also discussed some of the beautiful volcanic craters that had just been listed on the web site World Geography the day before. The first of these is Diamond Head, which is on the Hawaiian island of Oahu. The page lists a total of ten craters, each of which has a unique form that results from the volcanic events that created it, erosion and human activity since its creation, and climatic factors. The story of each is included, with a link to further information and an interactive map.
 Top-Ten List of Craters from World Geography
Seeing such fantastic images reminds us of other volcanic craters and calderas we have visited or hoped to visit. One of my favorites is Lake Atitlan in Guatemala, where I visited coffee farmers in 2008. A friend with whom I shared the Diamond Head photo told me that he had climbed the outer edge (it is very steep!) and had also visited the nearby Punchbowl/Puowaina crater, which has been both an ancient and a modern burial ground.

The United States Geological Survey is a good source of detailed  information about volcanoes in the United States and earthquakes worldwide. Its web site includes nearly instantaneous mapping of earthquakes, wherever in the world they may occur. The main USGS employs many geographers -- along with other scientists -- engaged in mapping and studying biological, water, mineral, and other natural resources.

Monday, December 3, 2012

North Reading Middle School - December 7

42° 34' 36" N
71° 05' 17" W

Learn more about Lat/Long

The EarthView team has visited North Reading several times. The most recent visit was almost exactly a year ago, on the last day of important climate-change meetings in South Africa. Similarly, this year's major climate-change meeting is ending on the day of our visit. It is being held in Doha, Qatar.

Qatar is a small country that emits three times as much carbon per person as the United States; in fact, it has the highest carbon emissions rate in the world. Qatar allowed its first-ever legal protests by visitors who objected to the contrast.

Protesters in Doha; image from Gulf Business
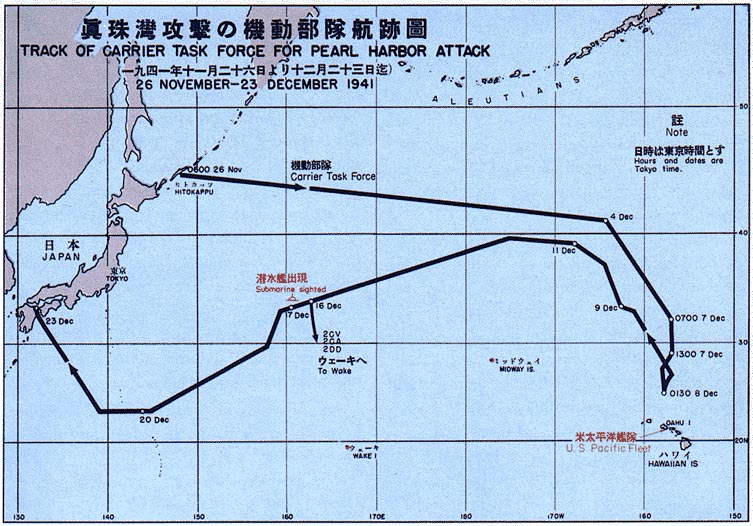
December 7 is also, of course, the "day that will live in infamy," according to President Franklin Roosevelt, as it was the 1941 date of the attack on Pearl Harbor that drew the United States into World War II. That single event was the beginning of many profound changes in the political and economic geography of the entire world.

Pearl Harbor was struck by planes flying from a nearby aircraft carrier. In 1966, the U.S. Government Printing Office produced maps that showed the path that had brought the carrier close to the island, and its route back to Japan.

Image: WikiMedia

Tuesday, November 27, 2012

East Middle School, Braintree -- Nov. 30


42°13'15"N 
70°59'23"W
(Learn more about Lat/Long, including how to look up by address

The EarthView team has enjoyed frequent visits to both East and South Middle Schools in Braintree, both for school-day programs and for evening Family Geography Night programs. We find a lot of interest in geography among students, teachers, parents, and administrators at both schools, and enjoy finding out what is currently being studied each time we visit.

During a visit to South Middle School a fortnight ago, we challenged Mr. Henry and his students to develop some activities relating to the latitude and longitude of the two schools. Mr. Henry was part of the first group of teachers to be trained in our EarthView Institute, so we know that even if the holiday has not allowed enough time to respond to our challenge (see the blog post for our November 16 visit), something interesting will come of it soon.

During our visit this week, we will find the location of one of the most interesting geography stories of the week -- the disappearing island of the Coral Sea! We first heard the story of this island on The World from Public Radio International, in a report called An Island That Isn't All There (we recommend reading and listening to the story).

1952 Italian map showing Sandy Island
PRI's The World
The island has appeared on maps for more than two centuries, but although a sea mountain makes the ocean somewhat shallower than the surrounding ocean floor (1400 meters), it cannot have been an island in historic times. The source of the error is not yet understood, but librarians at the Auckland Museum have been able to show find some very early references, which they report on the museum blog.

Apparently unsure what to do with such an unusual cartographic error, Google Maps currently shows the location as something like a virtual hole in the map -- as of the time of this writing, soon after the undiscovery.

Thursday, November 15, 2012

South Middle School, Braintree -- November 16


42°11'02"N 
70°59'53"W
(Learn more about Lat/Long


Throughout several years of the EarthView program, we have enjoyed several visits to South Middle School and East Middle School in Braintree, and are happy to be returning to both this month, starting with South. (Click on the EarthView Braintree search to see all of the blog posts about our visits, which include information about the geography of Braintree itself.) We enjoy these schools because of the great geography teachers and creative geography students, plus the support that geography receives from the families and school administrators. It is great to have two schools working together to learn geography.

We hope to help by seeing how many activities the geography students and teachers can do using our EarthView Experience map and the coordinates of the two schools. For example, what is located exactly halfway between the two schools? How far apart are the schools, based on the coordinates, the "ruler" in Google Maps, and various routes between the two? How far apart are they in time? What is on the opposite side of the earth from each?

The proverbial gauntlet has been thrown down. We will post a report from the two schools after we visit East Middle in a fortnight. Meanwhile, here are those coordinates:

42º 13' 14" N
70º 59' 20" W


View EarthView Experience in a larger map

Hurricane Sandy (see recent posts for some of the geography of the storm) had a geographic impact that some area birdwatchers were watching for. A number of birds, most notably the Northern Lapwing, was carried by the storm far from its usual range.


This member of the plover family was sighted in various places from Cape Cod to Middleborough and Halifax, Massachusetts. It is normally found only in Eurasia, as shown below. It spends summers and breeding seasons toward in northern parts of its range (shown yellow), with winters spent to the south (shown blue). It is resident in much of Europe, meaning that it is found year-round in these areas (shown green).

From WikiMedia -- click to enlarge

Monday, November 12, 2012

Spellman Museum, Weston -- November 12

42° 20' 55" N

71° 18' 26" W

Learn more about Lat/Long

(UPDATE: See photos from the visit below.)

EarthView is part of a public event at the Spellman Museum of Stamps and Postal History, which is located on the campus of Regis College in Weston. In fact, since the museum does not have high ceilings, the college is sharing its field house for the morning.


View Larger Map
The stamp museum and geographers have been working together for many years, because stamps are not only fun, they are geographic! Stamps are tiny snapshots of the cultural geography of places, and they also represent the connections between places. Read more about geography and the Spellman Museum in our February article.

EarthView team member Dr. Hayes-Bohanan has had several reasons to be a fan of the Spellman Museum since learning about it a few years ago. First of all, he attended a workshop on using stamps in teaching, which he calls "stamp camp." Second, he knows that the museum does a lot of fun and educational programs for people of all ages. Finally, he learned that the museum was dedicated by Cardinal Spellman on the day he (Dr. Hayes-Bohanan) was born!

Students at Foxborough Regional Charter School display some
of their 1.5 million stamps.
Our first visit takes place on Veteran's Day (as observed), which is also known as Remembrance Day. This weekend also marks the anniversary of Kristallnacht, a pogrom early in the history of the Holocaust. Students at Foxborough Regional Charter School have been studying this terrible history, and collecting postage stamps to represent the eleven million people who were killed. After four years of collecting, this project reached a milestone of 1.5 million stamps this weekend, representing all of the children who were victims. The project was described in a Boston Globe article, and is similar to the project described in the excellent documentary film Paper Clips.

Photos from the Visit

EarthView's visit to Spellman Museum was quite a success. The museum staff publicized the event and organized the visitors, and provided stamp activities that complemented the EarthView program beautifully. A steady stream of visitors enjoyed EarthView -- and the stamps -- throughout the morning. The athletic and facilities staff at Regis College graciously provided access to the college gym, which was an excellent venue.

Photographer, geographer, and former EarthView Wrangler Ashley Costa accompanied Drs. Hayes-Bohanan and Domingo for the Spellman Museum outing. Some of her photos are posted below; the rest will be on Flickr soon.

Stamps convey many geography lessons, including flag identification.
Participants were able to choose from among thousands of stamps
in making their own world maps.
Visitors placed stamps on blank maps of the world, using place-mat maps
as a guide for finding unfamiliar countries.
The EarthView team enjoyed the scores of visitors, from infants and
toddlers through primary, secondary, and college students.
Visitors also included very knowledgeable philatelists -- some of whom
have been collecting stamps for decades -- who shared some
geography lessons of their own. 
The EarthView team is certainly looking forward to its next visit to the Spellman Museum. Meanwhile, we encourage everyone to visit the Spellman Museum -- even on days when it does not have a giant globe -- for a unique way to learn geography!

Many more of Ashley Costa's photos from the day are in the Spellman-EarthView 2012 photoset on Flickr. Quite a few of these photos were taken from inside Earthview, so identifying some of the locations is a fun challenge.

Wednesday, November 7, 2012

Mashpee Middle School -- Nov. 9


41° 36' 57" N70° 30' 34" W

Learn more about Lat/Long


We are glad to be learning to the really big gymnasium at Mashpee Middle School, which we last visited in March of 2011. Please see the post from our previous visit for some interesting information about this unique town.

The town of Mashpee makes it convenient for residents to explore their community through an online Geographic Information System (GIS) hosted by Maps Online. The screenshot below shows the area surrounding the school itself, with identified wildlife habitat, vernal pools, and elevation contours featured. Viewers can examine other features of interest throughout the town and at a variety of scales.

Click to enlarge or make your own map at
Mashpee Maps Online

People throughout the world have been paying attention to the geography of the United States, because our presidential elections are decided by the Electoral College. Every major news organization made interactive maps available, such as this map from the New York Times, which is accompanied by maps for Senate and House seats as well.

As we all know, the entire Northeast region was recently affected by a major storm. In an earlier post, we described some of the geography related to forecasting for Hurricane Sandy. It became known as Super Storm Sandy because it was "only" a Category One hurricane, but was unusually large and arrived at the same time as a mid-latitude nor'easter storm.
October 28 image as shown by UK Telegraph.
The damage to utilities and transportation was immense, and many of us know people who are still without basic services in their homes in New Jersey, New York, and Connecticut. A second storm this week made recovery even more difficult. The experience is bringing renewed attention to ideas that geographers and other scientists are proposing for adaptation to the effects of climate change. The sea gate shown below, for example, is one of five ideas for preventing flooding in New York. These and other ideas -- some of which would only work for major cities -- were discussed yesterday on the On Point radio program.


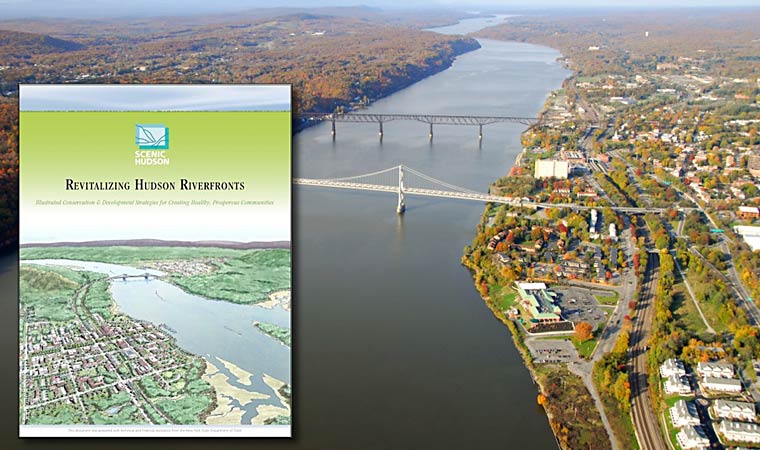
Meanwhile, planning and geography professionals in New York - a bit upriver from the City -- have created Revitalizing Hudson Riverfronts. It is both a book published in 2010 and a series of workshops and meetings to help communities prepare for rising water and other consequences of climate change. The next meeting is next week, and it is certain to get a lot of attention!